Let C be the length of the secret code and of the guesses the codebreaker
provides, and let N be the size of the alphabet from which each element of a
code can be drawn. We use the notation (C,N) to refer to a particularly-sized
game. For example, in the standard Mastermind game, each code is four colors
chosen from six possibilities, so we have
We use the term population to describe all possible codes of the specified length that can be created from the given alphabet. The symbol Q is used to describe the size of the population.
We will consider two types of scoring: Perfect-match (P) and Mastermind-type (M). With Perfect-match scoring, one point is awarded for each symbol in a guess code if and only if it occurs in the same position as in the secret code. For example, the Perfect-match score of the codes (3,4,1,1) and (3,2,1,4) is 2, corresponding to the digits 3 and 1 that occur in the first and third positions, respectively, in each code.
With Mastermind-type scoring, 10 points are awarded for every symbol of the guess code that is found in the same position as in the secret code, plus 1 point for every other symbol that is found in the secret code, but in an incorrect position. If a match occurs, the matching symbol in each code is removed from consideration for any further matches. Perfect matches are processed first. For example, the Mastermind-type score of the codes (3,4,1,1) and (3,2,1,4) is 21, with 10 points given for each of the digits 3 and 1 that occur in the first and third positions in each code, and 1 point for the digit 4 that occurs in each code, but not in the same position.
We also consider two classes of Mastermind-style games, those with symbols that are allowed to be repeated in the secret and guess codes (Y), and those with symbols that cannot be repeated (N). We can describe a game by its scoring type and whether or not repeated symbols are allowed. For example, MY refers to a game with Mastermind-type scoring and repeated symbols, and PN denotes a game with Perfect-match scoring and non-repeated symbols. The abbreviations PY, PN, MY and MN refer to the four scoring/repetition types considered here.
Repeated symbols
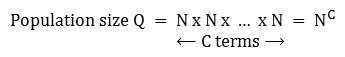
When the same alphabet symbol is allowed to appear more than once in a code, each element of the code is selected from the alphabet of N symbols (sampling with replacement). Each of the C code elements has the same N possibilities, so the total number of possible codes is
For example, in the standard (4,6) game with repeated symbols, the population size is
Non-repeated symbols
When repeated symbols are not allowed, we must have
N ≥ C, in order for there to be enough symbols in the
alphabet from which to draw C different ones (sampling without replacement).
The first symbol in a code can be chosen from any of the N alphabet symbols.
The second symbol cannot be the same as the first symbol, so it can be chosen
from the remaining
using factorial notation. For example, in the standard (4,6) game with non-repeated symbols, the population size is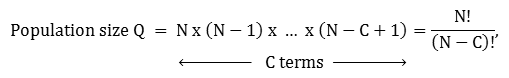
Since all symbols in a code are distinct, we can remap the alphabet symbols to an arbitrary sequence, and so without loss of generality, we can take the alphabet as the first N positive integers and assume that the reference (secret code) for score computations is the sequence (1,2,...,C).
Each of the four scoring/repetition types can be considered to have a discrete
probability distribution of scores over all of the Q2 possible pairs
of codes. We can use the two-letter scoring/repetition abbreviation to denote a
random variable taking on the possible scores for that particular type of game.
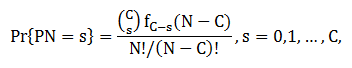
For example, the probabilities for the
Pr{PN = 1} = 46,080/129,600 = 35.5% for the (4,6) gameA Mastermind-type score of 10(C-1) + 1 (e.g., 31 in the standard game) is impossible since having exactly
Pr{MY = 10C - 9} = Pr{MN = 10C - 9} = 0In Mastermind-type scoring, the sum of the tens and units digits of the score can between 0 and C, inclusive, as can be the tens digit. Therefore, when the tens digit is i, the possible units digits are 0,...,C-i, which is
For example, in the standard (4,6) game, Mastermind-type scores can take any of the following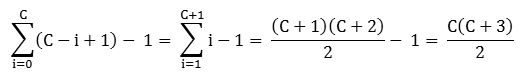
0, 1, 2, 3, 4, 10, 11, 12, 13, 20, 21, 22, 30, 40Depending on the relative sizes of C and N, some impossible scores can be predicted when repeated symbols are not allowed. If
Pr{MN = 10A + B} = 0 whenever the sum of digits A + B < 2C - NFor example, in the standard (4,6) game with non-repeated symbols, we have
Pr{MN = 0} = Pr{MN = 1} = Pr{MN = 10} = 0 (indicated in bold in the list above)Finally, we note that in the particular case N = C, the entire alphabet is consumed in every code, and so it is impossible to have
Pr{PN = C - 1} = 0 if N = C
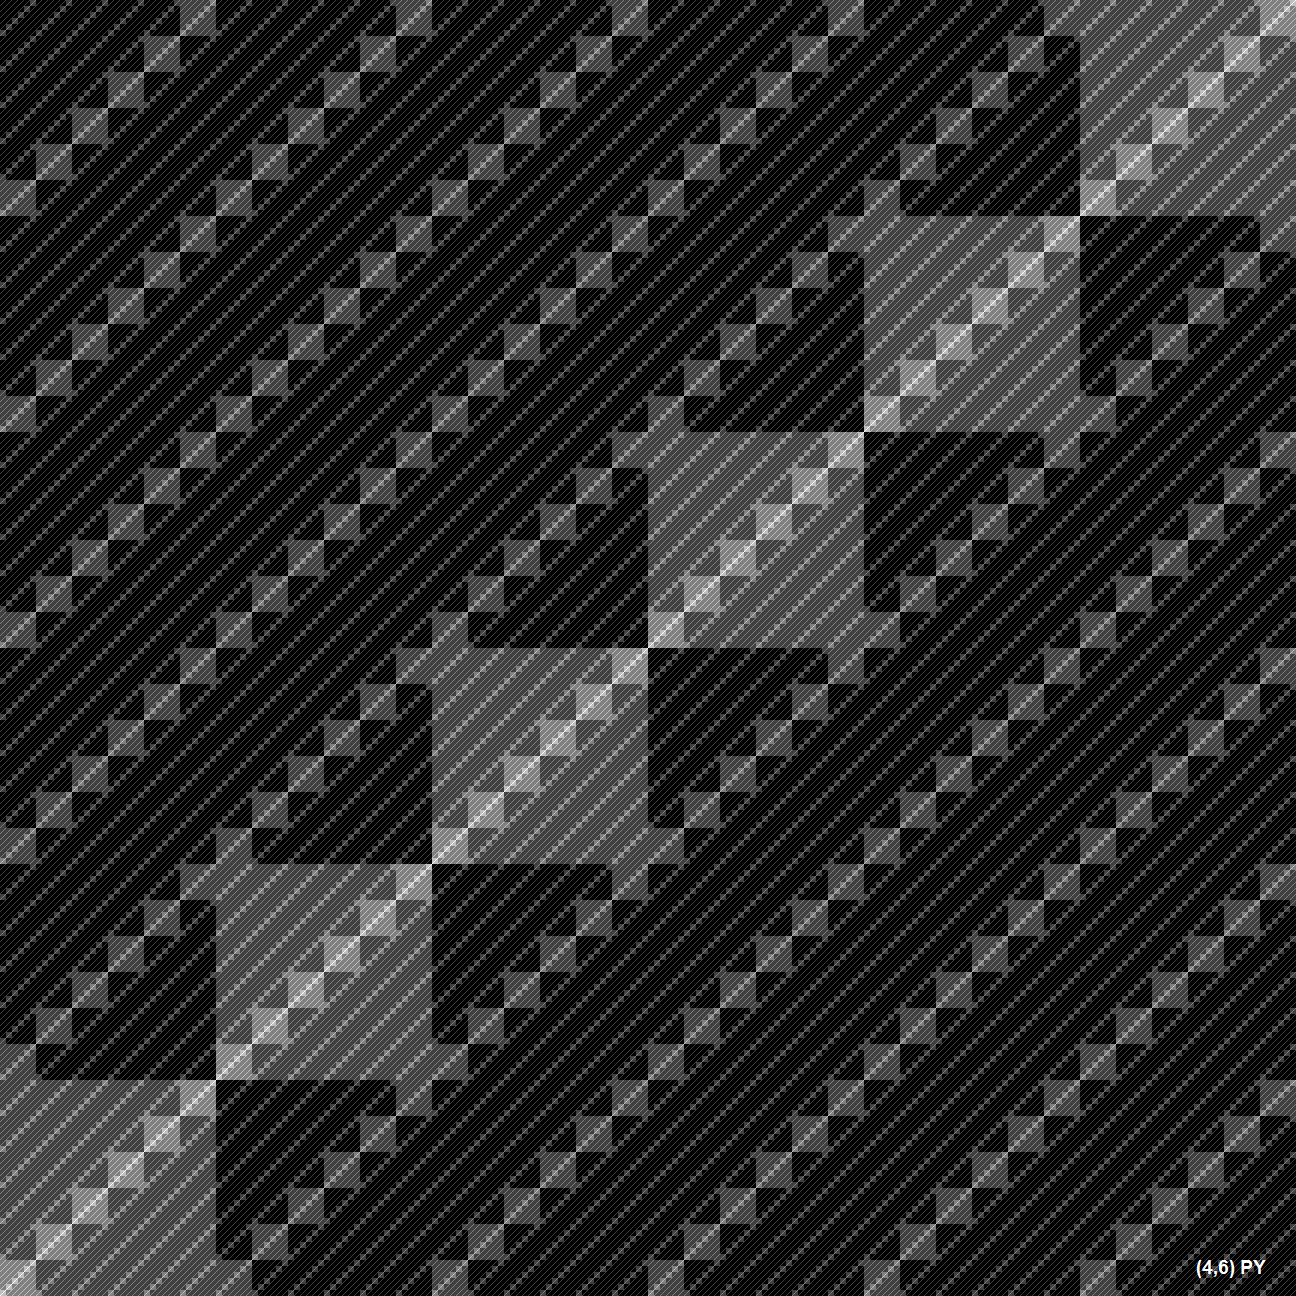
To assign pixels to codes, let the pixel index range from 0 to NC -
1, and let the alphabet consist of N consecutive digits beginning with 0. Then
each code is the base-N representation of the pixel index; for example, in the
standard (4,6) game, the code associated with index 0 is
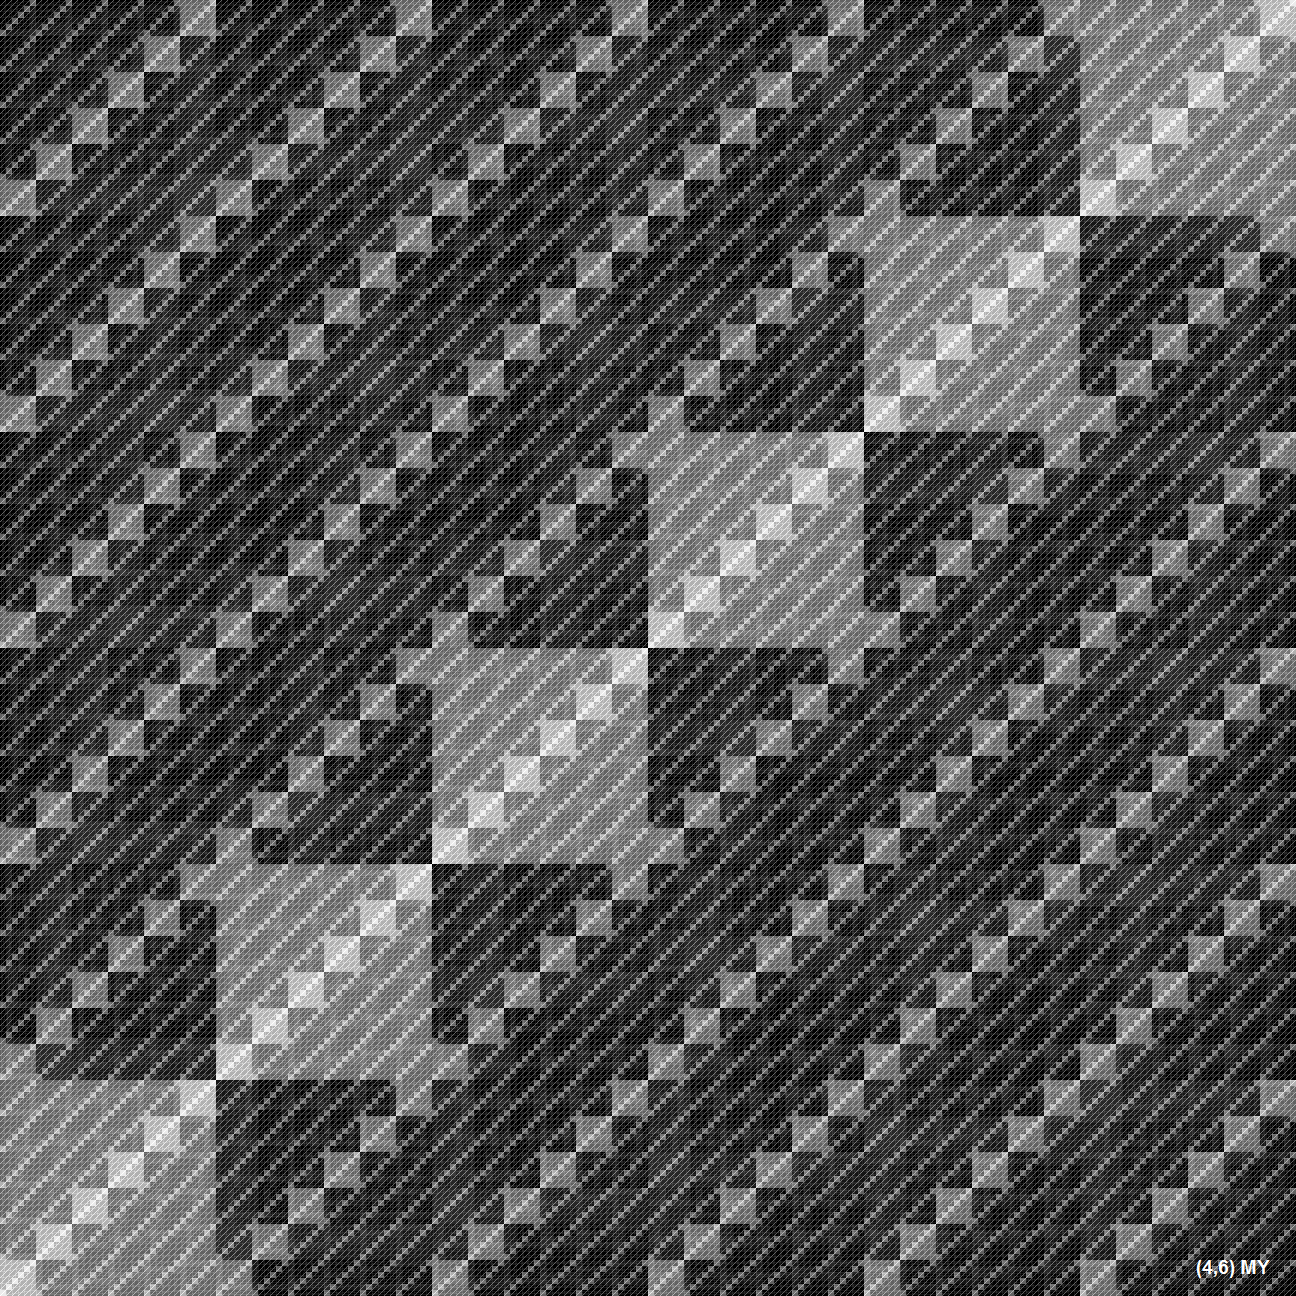
With the origin at lower left, the intensity of the pixel at position (x,y) is the score associated with code indexes x and y. A black pixel corresponds to a score of 0, and a white pixel is used for the maximum possible score (which depends on the scoring type). Proportionally-varying shades of gray are used for intermediate scores. The diagonal of the plot is all white since the score of a code combined with itself is always the maximum score.
There typically are lighter diagonal lines and squares throughout the graph
where the pixel indexes differ by a constant amount due to the associated codes
having multiple digits in agreement; for example, points (x,y) where
Perfect-match scoring (relatively few gray levels due to only 5 possible scores):
Click image for full resolution
Mastermind-style scoring (more details resulting from 14 gray levels):
Click image for full resolution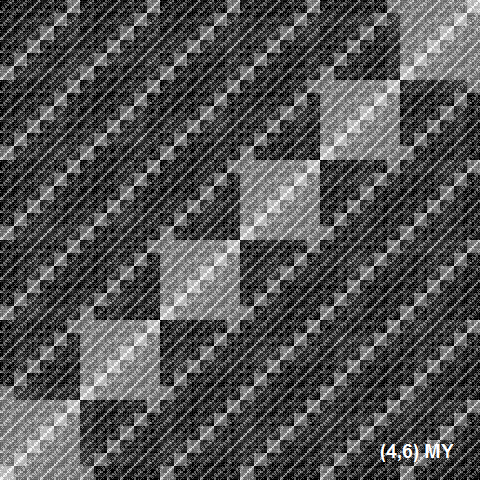
The corresponding pixel graphs for other game sizes have a similar appearance.
When codes are allowed to have repeated elements, the score distribution is based on sampling individual symbols with replacement, and a binomial probability distribution is applicable. We assume that the alphabet of symbols in a game is the positive integers. Considering the scoring of one symbol at a time as a Bernoulli trial, the probability of a success (1 point earned) is simply the chances of a randomly-selected number from the alphabet 1,...,N matching its ordinal position in the code pattern being constructed, or 1/N. Each trial is independent of the others, so the score probabilities follow the binomial distribution
The mean of this score distribution is C/N [1].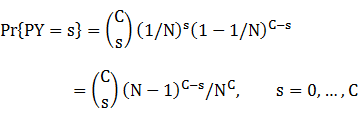
For example, in the standard (4,6) game with repeated symbols and Perfect-match scoring, the scores have the following probabilities:
(4,6) PY
Score Probability 0 625/1296 48.23% 1 500/1296 38.58% 2 150/1296 11.57% 3 20/1296 1.54% 4 1/1296 0.08% Mean score: 4/6 = 0.67
where fm is an mth-degree polynomial function of N-C ≥ 0. The first few functions fm are:
(1)
f0(n) = 1for n ≥ 0 (OEIS A094791).f1(n) = n
f2(n) = n2 + n + 1
f3(n) = n3 + 3n2 + 5n + 2
f4(n) = n4 + 6n3 + 17n2 + 20n + 9
f5(n) = n5 + 10n4 + 45n3 + 100n2 + 109n + 44
f6(n) = n6 + 15n5 + 100n4 + 355n3 + 694n2 + 689n + 265
If gm(n) denotes the mth forward difference of the factorial numbers:
gm+1(n) = gm(n+1) - gm(n), g0(n) = n!,then fm(n) is related to gm(n) by
fm(n) = gm(n)/n!It follows that fm(n) obeys the difference equation
Interestingly, in the probabilities above, the polynomial functions fm are evaluated only for the difference N-C, so many of the same results can be applied for multiple game sizes.
fm+1(n) = (n+1)fm(n+1) - fm(n), f0(n) = 1. (2)
Now assume for the moment that N = C. Then all alphabet symbols are consumed in creating each of the C! possible codes, and the number of codes with a given score s in the range 0,1,...,C is simply the number of code elements occurring in their ordered position, known as the partial derangement
where !(C-s) is the subfactorial of C-s. The associated score probability is the ratio of R(C,s) to the number of possible codes: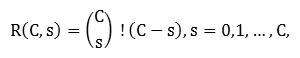
Noting that N!/(N-C)! = C! in this case, we can combine (1) with the immediately preceding results to obtain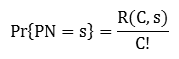
from which we can see that fm(0) = !m for all m.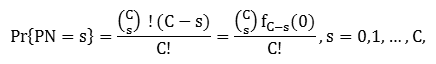
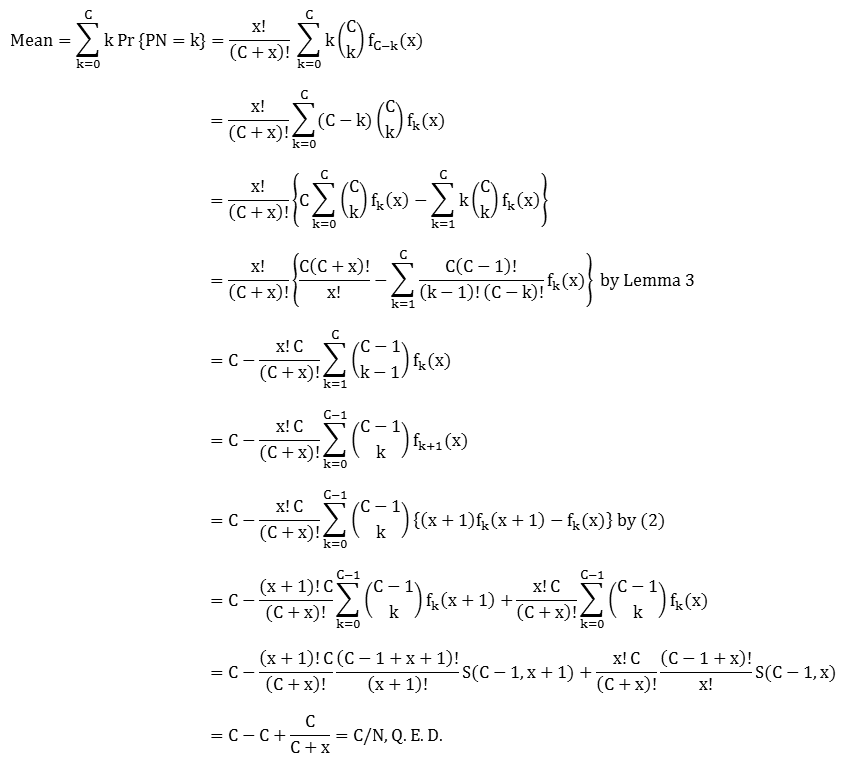
Lemma 3 shows by a simple induction argument that the probabilities (1) sum to unity. An analogous approach is used in Lemma 4 to determine that the mean of the score probability distribution is C/N, which is the same mean as in the repeated-symbols case PY.
For example, in the standard (4,6) game with non-repeated symbols and Perfect-match scoring, the scores have the following probabilities:
(4,6) PN
Score Probability 0 181/360 50.28% 1 128/360 35.56% 2 42/360 11.67% 3 8/360 2.22% 4 1/360 0.28% Mean score: 4/6 = 0.67
In contrast to the grayscale representations shown earlier, the score probability distribution function (pdf) can be plotted in the usual way. The following graph shows the score pdfs for the standard (4,6) game with Mastermind-type scoring. There is some skew toward higher scores for non-repeated symbols (blue) as compared to repeated symbols (red).
Symbols: Repeated Non-repeated Scoring: Mastermind type
(T)Perfect Match
(CF)Mastermind type
(T)Perfect Match
(CF)Score: 0 7.24% 48.23% 50.28% 1 18.66% 38.58% 35.56% 2 17.15% 11.57% 23.33% 11.67% 3 4.89% 1.54% 24.44% 2.22% 4 0.28% 0.08% 2.50% 0.28% 10 13.93% 11 17.49% 13.33% 12 6.82% 20.00% 13 0.34% 2.22% 20 8.10% 3.33% 21 3.09% 6.67% 22 0.39% 1.67% 30 1.54% 2.22% 40 0.08% 0.28% Mean score: 7.71 0.67 8.67 0.67 (T): Tabulated
(CF): Closed form
The level of pdf skew between the two types of repetition varies for other game sizes and scoring types.
Abbreviation Scoring Symbols Population size Mean PY Perfect match Repeated NC C/N PN Perfect match Non-repeated N!/(N-C)! C/N
Score Mastermind
(4,6) MYBulls and Cows
(4,10) MNSuper Mastermind
(5,8) MYJotto variant
(5,9) PN0 7.2392% 7.1429% 4.8198% 56.5079% 1 18.6614% 28.5714% 16.1431% 33.1019% 2 17.1539% 25.0000% 19.4595% 8.8624% 3 4.8868% 5.2381% 9.3007% 1.3889% 4 0.2840% 0.1786% 1.5195% 0.1323% 5 0.0482% 0.0010% 0.0066% 10 13.9318% 9.5238% 8.2602% 11 17.4897% 14.2857% 16.1769% 12 6.8158% 4.2857% 10.1997% 13 0.3429% 0.1587% 1.9276% 14 0.0720% 20 8.1019% 3.5714% 4.8299% 21 3.0864% 1.4286% 4.4460% 22 0.3858% 0.1190% 1.1516% 23 0.0401% 30 1.5432% 0.4762% 1.1482% 31 0.3204% 32 0.0267% 40 0.0772% 0.0198% 0.1068% 50 0.0031% Mean
score7.7144 5.2000 7.6417 0.50
In many game implementations, the total of pips on the five secret dice is provided, which considerably reduces the number of feasible patterns at each move, as well as increases the average score (as would be expected since more information on the secret pattern is provided). The sum of the dice ranges from 5 to 30, or in the general case, from C to CN. For each dice sum, there is a separate distribution of scores ranging from 0 to C. However, a score of C-1 will never occur since knowing all of the die values but one, as well as the sum of the dice, implies that the remaining die value is also known.
Consider a dice pattern having sum T. Each die's value is of the form
0 ≤ ai ≤ N-1, i=1,...,Cand
which can be written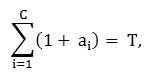
Therefore, at most T - C of the ai's are nonzero, or equivalently, at least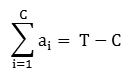
Analogously, each die is also of the form N - bi, where the integers bi satisfy
0 ≤ bi ≤ N-1, i=1,...,Cand
which can be written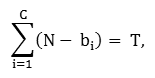
Therefore, at most CN - T of the bi's are nonzero, or equivalently, at least
In general, the minimum score is
For the (5,6) Five Dice game, the 26 possible score distributions are listed horizontally as follows:
Some of these distributions are plotted below:
Score Mean
scoreSum 0 1 2 3 5 5 100.0000% 5.0000 6 100.0000% 5.0000 7 44.4444% 55.5556% 4.1111 8 8.1633% 48.9796% 42.8571% 3.7755 9 3.0612% 10.2041% 57.1429% 29.5918% 3.4286 10 0.3149% 1.8896% 14.2353% 64.4999% 19.0602% 3.1916 11 0.2380% 5.4729% 14.9911% 63.0577% 16.2403% 3.0583 12 0.6450% 5.4824% 19.3496% 62.0263% 12.4966% 2.9274 13 0.8787% 8.9569% 18.0839% 61.5646% 10.5159% 2.8240 14 1.3032% 8.7963% 22.4280% 58.6420% 8.8306% 2.7373 15 0.8636% 13.4780% 19.2166% 57.8762% 8.5656% 2.6837 16 1.2958% 12.6059% 21.4540% 56.8097% 7.8347% 2.6512 17 1.0930% 13.3629% 21.4826% 56.5746% 7.4869% 2.6349 18 1.0930% 13.3629% 21.4826% 56.5746% 7.4869% 2.6349 19 1.2958% 12.6059% 21.4540% 56.8097% 7.8347% 2.6512 20 0.8636% 13.4780% 19.2166% 57.8762% 8.5656% 2.6837 21 1.3032% 8.7963% 22.4280% 58.6420% 8.8306% 2.7373 22 0.8787% 8.9569% 18.0839% 61.5646% 10.5159% 2.8240 23 0.6450% 5.4824% 19.3496% 62.0263% 12.4966% 2.9274 24 0.2380% 5.4729% 14.9911% 63.0577% 16.2403% 3.0583 25 0.3149% 1.8896% 14.2353% 64.4999% 19.0602% 3.1916 26 3.0612% 10.2041% 57.1429% 29.5918% 3.4286 27 8.1633% 48.9796% 42.8571% 3.7755 28 44.4444% 55.5556% 4.1111 29 100.0000% 5.0000 30 100.0000% 5.0000
The probability distribution of the dice sum itself is known in piecewise form; see [2] and this reference. The dice sum distribution is symmetric about its mode(s), and its mean is C(N+1)/2, which is the midpoint of the minimum and maximum possible sums. Since each of the N die values is equiprobable and is determined independently of the other dice (repeated symbols), the dice sum distribution approaches the normal as C increases, by the Central Limit Theorem [3].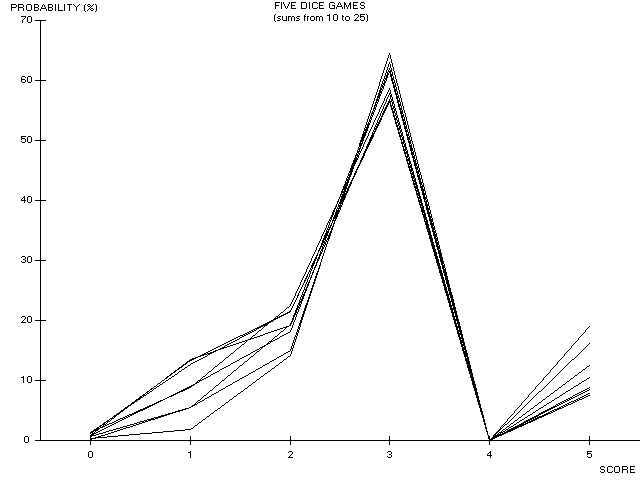
Proof. Let a = -1 and b = 1 in the Binomial Theorem:
Lemma 2.
for nonnegative integers n, where ! k is the subfactorial of k.
Proof by induction.
so the formula holds for n = 0. Assume the formula holds for n. Then using Euler's recurrence relation
(OEIS A000166), we have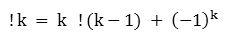
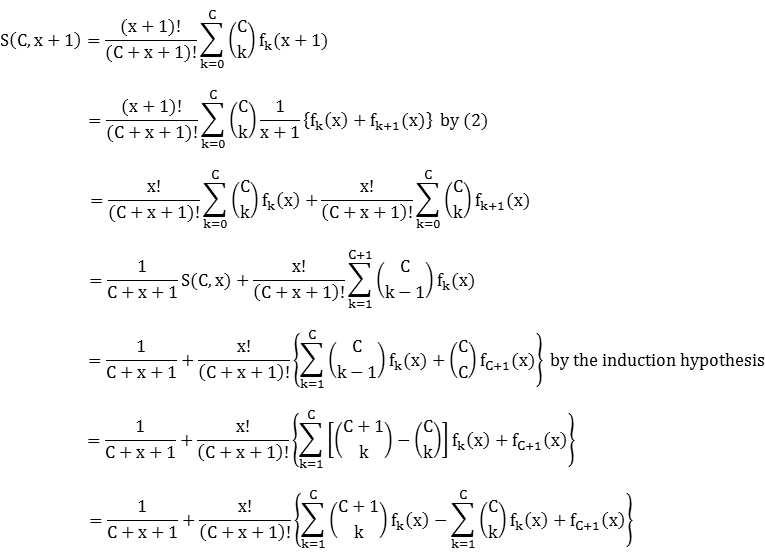
Lemma 3.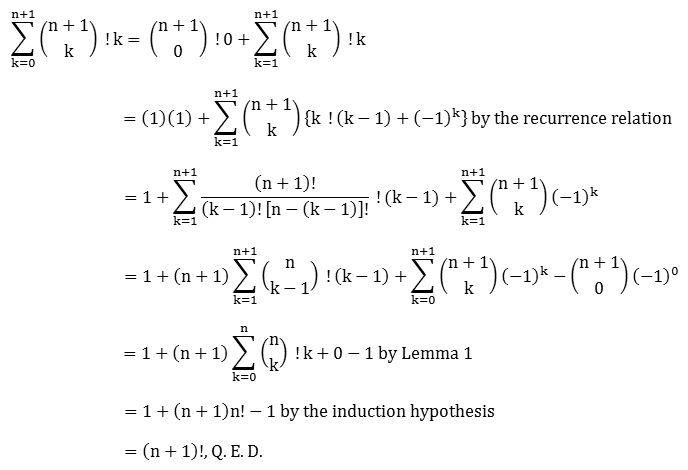
Let x = N - C ≥ 0 in (1) and let S(C,x) denote the sum of score probabilities
after reversing the summation on k. When x = 0 (N = C), we have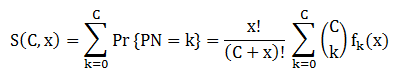
For proof by induction, assume S(C,x) = 1 for all C. Then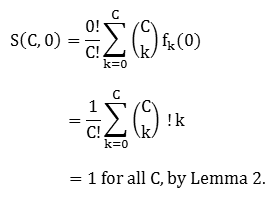
by Pascal's Rule. The first term in braces
(5)
by the induction hypothesis. Similarly, the second term in braces in (5)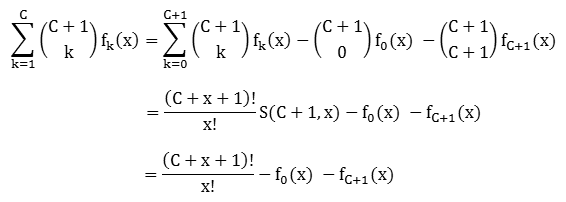
so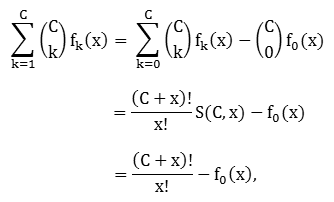
Lemma 4.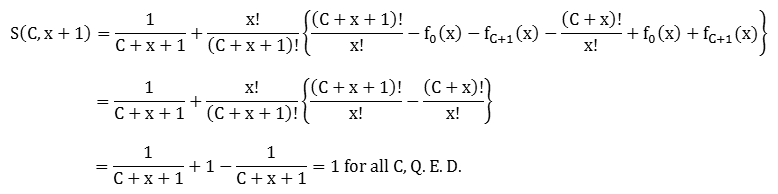
An analogous approach to Lemma 3 is used to determine the
mean of the probability distribution S(C,x). Again let
[2] Uspensky, J. V., Introduction to Mathematical Probability (New York: McGraw-Hill, 1937), pp. 23-24.
[3] Hoel, Port & Stone, op. cit., p. 185.
Copyright © 2023 Balmoral Software (http://www.balmoralsoftware.com). All rights reserved. Republication, redistribution or conversion is expressly prohibited without the prior written consent of Balmoral Software.